Radiography
We first repeat the result from the beam attenuation due to scattering section on the Basics of neutron scattering page that the neutron flux, \(\Psi\), inside a sample is exponentially damped (the Beer - Lambert law):
\begin{equation} \Psi(z)=\Psi(0)\exp{\left(- \int_0^z \mu(z')dz'\right)} \label{eq:flux}\end{equation}
where \(z\) is the depth in the sample and \(\mu(z')\) is the total attenuation coefficient at the given position in the sample. The total attenuation is the sum of the absorption and scattering attenuations.
\begin{equation} \mu=\mu_a+\mu_s , \label{eq:abs} \end{equation}
Hydrogen and boron both give a strong attenuation of the neutron beam, but in the case of hydrogen the attenuation is mainly due to scattering, while for boron the attenuation is dominated by absorption, see Figure xx--CrossReference--fig:abs_Xn--xx. The two processes can not be distinguished in the radiographic images, as only the transmitted neutrons are detected.
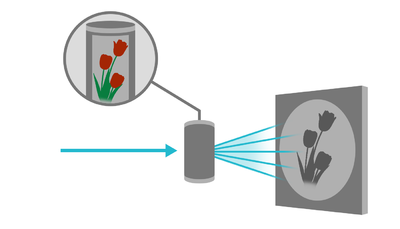
The experimental set-up is relatively simple, as it is a basic pinhole geometry due to the limited potential of optics with neutrons. The set-up is illustrated in Figure xx--CrossReference--fig:setup--xx. In such a set-up the available flux is strongly coupled with the achievable spatial resolution. Like in many other cases and techniques, increasing resolution directly implies a trade-off in available flux and hence increases the exposure time.
The spatial resolution in an image gives the size of the structures that can be investigated, e.g.~how close points in an object can be to each other but still be distinguished. The temporal resolution in a series of radiographic images is related to the acquisition time for a single image and is especially important when considering dynamic processes. Both the temporal and spatial resolution depend on the pinhole size, the collimation length (flight path), and the detector system, to be explained in the following.
Spatial resolution
Currently, the spatial resolution at state-of-the-art instruments is of the order of 100 \(\mu\)m down to 20 \(\mu\)m. The spatial resolution is limited by two factors:
- The geometry of the pinhole set-up, including the pinhole size, the pinhole-sample and sample-detector distances.
- The intrinsic detector resolution, i.e. the uncertainty of the determination of the position in the physical and digital detection process.
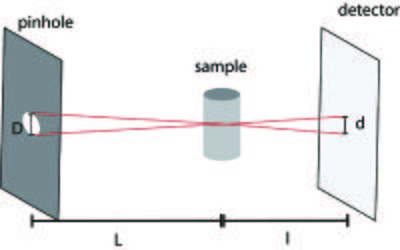
In the basic pinhole geometry, illustrated in Figure xx--CrossReference--fig:collimator--xx, the optimum source for imaging is a point source, but at a real beam line, a pinhole with a finite size has to be used. For such a geometry it can easily be derived that for a pinhole with diameter \(D\), the resolution is limited geometrically by the image blur, given by [1]
\begin{equation} d = D \frac{l}{L} . \end{equation}
where \(L\) and \(l\) is the pinhole-sample and sample-detector distance, respectively, defined in Figure xx--CrossReference--fig:collimator--xx.
The collimation ratio is defined as the ratio between the pinhole-sample distance and the pinhole size, \(L/D\), and is a key parameter for a set-up. The higher the collimation ratio, the better the spatial resolution for a finite sample-detector distance, \(l\). The sample is placed as close as possible to the detector system, in order to achieve high resolution.
The collimation ratio can be increased by decreasing the pinhole diameter or increasing the pinhole-sample distance. Due to the divergence of the beam in the pinhole (of magnitude a few degrees), the beam opens into a cone and the flux decreases as the inverse square of the distance from the pinhole. Therefore, increasing the collimation ratio by a factor of two, either by increasing the distance or decreasing the pinhole diameter, reduces the flux by a factor four.
The second aspect of the spatial resolution is related to the detector system and depends on the size of the pixel elements and the precision in position by with the neutron can be detected. A neutron hitting one pixel element might also be counted in neighbouring pixels, meaning that the spatial resolution often is less than the actual detector pixel size will allow. By definition, the spatial resolution cannot be better than two times the pixel size. The basic principles will be explained in the Imaging#Detection section.
Temporal resolution
The achievable time resolution in kinetic studies depends on the available flux and the detector efficiency. The required exposure time is ruled by the signal-to-noise ratio. The relative image noise decreases when the number of counts in a detector pixel increases. Hence, the signal-to-noise ratio depends on the source flux, the size of the pinhole, the source-detector distance, the exposure time, the attenuation of the sample, the detector efficiency and additional detection noise, e.g. dark current and read out noise. Therefore the best trade off between spatial resolution and the signal-to-noise ratio has to found for each (in particular kinetic) experiment. Other sources of noise are, however, given by e.g. gamma radiation and fast neutrons reaching the detector. These background noise sources are to be avoided as much as possible through instrumentation means like shielding, filters, and avoiding a direct line of sight from the detector to the neutron source.
Neglecting the detector and background noise, it can be assumed that the counting statistics of the detector is Poisson distributed and the signal-to-noise ratio is given by \(\sigma(N)/N=1/\sqrt{N}\), where \(N\) is the number of counts in a single detector pixel.
To improve the spatial resolution both the geometric resolution, \(d\), and the effective pixel size must be reduced. Both decrease the counting number in each detector pixel, meaning that the exposure time has to be increased correspondingly to have unchanged signal-to-noise ratio. In the most efficient case the resolution of the detector system matches the geometric resolution of the set-up. The higher the signal-to-noise ratio the better objects with similar attenuation coefficients (and thickness's) can be distinguished in a radiographic image. The neutron flux at most beam lines is of the order \(10^6-10^8\) neutrons/cm\(^2\)/s and with a pixel size of the order 100 \(\mu\)m the number of counts per pixel is \(10^3-10^6\) neutrons/s.
Detection
As outlined above, the main parameters characterizing an imaging detector are the detection efficiency, the electronic noise and the intrinsic spatial resolution. The most common detectors used for neutron imaging are scintillator screens in conjunction with CCD (charge-couple-device) cameras and flat amorhous-Si detectors[1][2], but meanwhile also MCP (microchannel plate) based detectors [3]. In the scintillator screen the neutrons are absorbed and visible light is emitted, which can be detected by the CCD. The most commonly used scintillator material is crystalline \(^6\)LiF/ZnS:Ag, where the neutrons are converted by the Li-atoms in order to produce light by the ZnS scintillator material[4]. The doping with silver shifts the light emission to be around 450 nm, which is in the range where the CCD is most efficient. The thickness of the scintillator screen is between 0.03 mm and 0.2 mm. The thicker the screen the more neutrons are absorbed, but the spatial resolution decreases correspondingly.
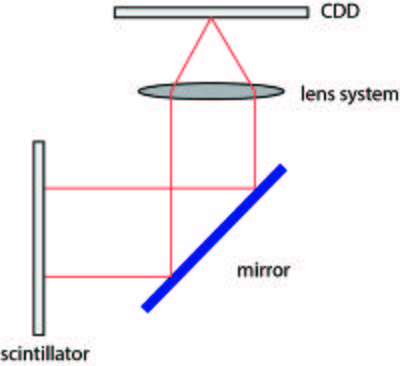
Not all neutrons will be absorbed in a scintillator screen and the CCD chip will suffer from radiation damage if placed directly behind the scintillator screen. Therefore a mirror is placed in an angle of 45\(^\circ\) behind the scintillator screen and the light is reflected to the CCD chip. A lens system is placed between the mirror and the CCD in order to record an image of the light from the scintillator on the chip, illustrated in Figure xx--CrossReference--fig:detector--xx.
Amorphous Si-detectors and MCP detectors can be placed directly in the beam and function without optics. Both the amorhous-Si and the MCP detectors require a converter, typically based on \(^{10}\)B, which has a high absorption cross section for thermal neutrons. The neutrons are captured by \(^{10}\)B to produce \(^7\)Li and \(\alpha\)-particles. For the Si-detector, the \(\alpha\)-particles pass on to the detection layer, a biased silicon layer [5]. For the MCP detector the \(\alpha\)-particles and lithium nuclei liberate free secondary electrons into the adjacent evacuated channel, illustrated in an animation [1].
Experimental considerations
In the experimental set-up factors such as electronic noise and inhomogeneities in the detector efficiency and variation in the incident beam intensity both temporally and in time, effects the image quality.
To improve image quality three images are combined to form the final image; a projection image of the sample, a dark-field and a flat-field image. The dark-field image is a image with the beam turned off used to corrected for dark-current in the detector system, meaning counts in the detector not related to the neutron beam. These counts must be subtracted from the projection images. A flat-field image is an image with open beam shutter, but without the sample placed in the beam path. The flat-field image is used to correct for inhomogeneities in the beam profile and in the detector screen. The projections (transmission image) are for each pixel corrected with both the dark-field and the flat-field images.
\begin{equation} T_{\theta}=\frac{I_{\theta}-DF}{FF-DF} \label{eq:trans}\end{equation}
with \(I_{\theta}\) being the original projection image, \(DF\) is the dark field image and \(FF\) is the flat-field image.
- ↑ 1.0 1.1 M. Strobl et al., Journal of Physics D: Applied Physics 42 (2009), p. 243001
- ↑ I. S. Anderson and R. L. McGreevy and H. Z. Bilheux, Neutron imaging and applications (Springer, 2009)
- ↑ A. S. Tremsin and W. Bruce Feller and R. Gregory Downing, Nuclear Instruments and Methods A 539 (2005), p. 278-311
- ↑ V. Litvin et al., Bulletin of the Russian Academy of Sciences: Physics 73 (2009), p. 219-221
- ↑ C. Kittel, Introduction to Solid State Physics (Wiley, 2004)


