Imaging
Authors: Maria Thomsen, Niels Bohr Institute, University of Copenhagen, and Markus Strobl, European Spallation Source, Lund, Sweden
Introduction to imaging
In neutron imaging the interior structure of a sample is visualised in real space with a resolution of the order 10-100 micrometer, unlike scattering experiments where the information is obtained in reciprocal space and is an average over the sample volume illuminated. Like the scattering techniques, the imaging method is non-destructive and has been used in a wide variety of applications ranging from inspection of objects of preservation interest (e.g. cultural heritage) and industrial components to visualization and quantification of interior dynamical processes (e.g. water flow in operational fuel cells).
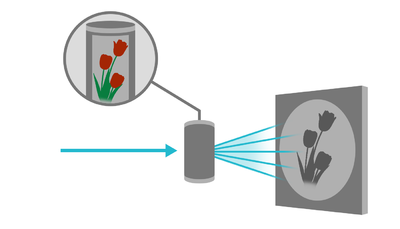
Neutron imaging is in general restricted to take place at large scale facilities. One example is the ICON beamline at SINQ, PSI, where a schematic illustration is shown in Figure xx--CrossReference--fig:icon--xx[1].
One aspect of imaging is radiography. Here, a two-dimensional (2D) map of the transmitted neutrons are obtained at the detector screen, similar to X-ray radiography known from the hospitals. The Radiography section deals with the instrumentation needed for neutron imaging, including spatial and temporal image resolution and the detector system. Another aspect of imaging is computed tomography (CT), which is well known for X-rays, but also feasible with neutrons. Here, the sample is rotated around an axis perpendicular to the beam direction and radiographic projection images are obtained stepwise from different view angles. These images are combined mathematically to give the three-dimensional (3D) map of the attenuation coefficient in the interior of the sample. This will be explained in detail in Computed tomography section.
Attenuation
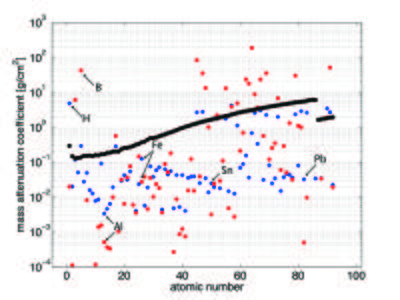
The neutron attenuation can happen either by absorbtion or scattering. The corresponding cross sections are given in the cross section table on the Basics of neutron scattering page for some elements. In Figure xx--CrossReference--fig:abs_Xn--xx, we show the attenuation coefficient for all elements as a function of atomic number for thermal neutrons (25 meV), compared to the absorption cross section for X-rays (100 keV). Whereas neutrons interact with the nuclei of matter, X-rays interact with its electrons. With X-rays, the attenuation is higher, the higher the electron density (the higher the atomic number). There is no such regular correlation for the interaction between neutrons and matter, and hence the attenuation coefficients are irregularly distributed independent of the atomic number. In the figure the mass attenuation coefficients are given as \({\mu}/{\rho}\), with \(\rho\) being the density. The linear attenuation coefficient, \(\mu\), has the unit of reciprocal length. The relationship between the attenuation coefficient and the cross section is given by
\begin{equation} \frac{\mu}{\rho}=\frac{N_a}{M}\sigma \end{equation}
where \(N_a\) is Avogadros number, \(M\) is the molar mass, and \(\sigma\) is the total cross section.
It is seen from the figure that the light elements, such as hydrogen and boron, have a very low absorption cross section for X-rays while they strongly scatter (blue) or absorb (red) neutrons. In contrast, many important metals can much easier be penetrated by neutrons than by X-rays (Al, Fe, Sn, and Pb are marked in Figure xx--CrossReference--fig:abs_Xn--xx as examples).
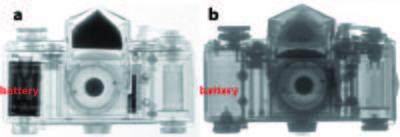
Neutron imaging can in many cases be used as a complementary technique to the X-ray radiography. This is illustrated in Figure xx--CrossReference--fig:abs_camera--xx, which shows a radiographic image of an analog camera obtained with X-rays (a) and neutrons (b). In the X-ray image the metal parts from the battery are attenuating strongly, but seem totally transparent to neutrons. Neutrons, on the other hand, display strong contrast to image the lighter polymer (plastic) parts containing significant amounts of hydrogen. Because neutrons interact directly with the nuclei, the attenuation coefficient differs even between isotopes (unlike the X-ray attenuation), making is possible to distinguish for example the water types: hydrogen oxide (normal water, H\(_2\)O) and deuterium oxide (heavy water, D\(_2\)O), because the total cross section for hydrogen is 40 times that of deuterium, see the cross section table on the Basics of neutron scattering page.
Radiography
We first repeat the result from the beam attenuation due to scattering section on the Basics of neutron scattering page that the neutron flux, \(\Psi\), inside a sample is exponentially damped (the Beer - Lambert law):
\begin{equation} \Psi(z)=\Psi(0)\exp{\left(- \int_0^z \mu(z')dz'\right)} \label{eq:flux}\end{equation}
where \(z\) is the depth in the sample and \(\mu(z')\) is the total attenuation coefficient at the given position in the sample. The total attenuation is the sum of the absorption and scattering attenuations.
\begin{equation} \mu=\mu_a+\mu_s , \label{eq:abs} \end{equation}
Hydrogen and boron both give a strong attenuation of the neutron beam, but in the case of hydrogen the attenuation is mainly due to scattering, while for boron the attenuation is dominated by absorption, see Figure xx--CrossReference--fig:abs_Xn--xx. The two processes can not be distinguished in the radiographic images, as only the transmitted neutrons are detected.
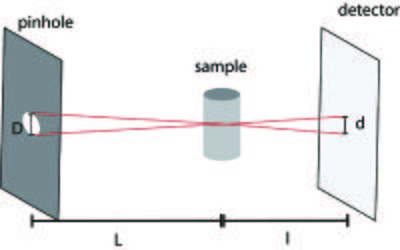
The experimental set-up is relatively simple, as it is a basic pinhole geometry due to the limited potential of optics with neutrons. The set-up is illustrated in Figure xx--CrossReference--fig:setup--xx. In such a set-up the available flux is strongly coupled with the achievable spatial resolution. Like in many other cases and techniques, increasing resolution directly implies a trade-off in available flux and hence increases the exposure time.
The spatial resolution in an image gives the size of the structures that can be investigated, e.g.~how close points in an object can be to each other but still be distinguished. The temporal resolution in a series of radiographic images is related to the acquisition time for a single image and is especially important when considering dynamic processes. Both the temporal and spatial resolution depend on the pinhole size, the collimation length (flight path), and the detector system, to be explained in the following.
Spatial resolution
Currently, the spatial resolution at state-of-the-art instruments is of the order of 100 \(\mu\)m down to 20 \(\mu\)m. The spatial resolution is limited by two factors:
- The geometry of the pinhole set-up, including the pinhole size, the pinhole-sample and sample-detector distances.
- The intrinsic detector resolution, i.e. the uncertainty of the determination of the position in the physical and digital detection process.
In the basic pinhole geometry, illustrated in Figure xx--CrossReference--fig:collimator--xx, the optimum source for imaging is a point source, but at a real beam line, a pinhole with a finite size has to be used. For such a geometry it can easily be derived that for a pinhole with diameter \(D\), the resolution is limited geometrically by the image blur, given by [1]
\begin{equation} d = D \frac{l}{L} . \end{equation}
where \(L\) and \(l\) is the pinhole-sample and sample-detector distance, respectively, defined in Figure xx--CrossReference--fig:collimator--xx.
The collimation ratio is defined as the ratio between the pinhole-sample distance and the pinhole size, \(L/D\), and is a key parameter for a set-up. The higher the collimation ratio, the better the spatial resolution for a finite sample-detector distance, \(l\). The sample is placed as close as possible to the detector system, in order to achieve high resolution.
The collimation ratio can be increased by decreasing the pinhole diameter or increasing the pinhole-sample distance. Due to the divergence of the beam in the pinhole (of magnitude a few degrees), the beam opens into a cone and the flux decreases as the inverse square of the distance from the pinhole. Therefore, increasing the collimation ratio by a factor of two, either by increasing the distance or decreasing the pinhole diameter, reduces the flux by a factor four.
The second aspect of the spatial resolution is related to the detector system and depends on the size of the pixel elements and the precision in position by with the neutron can be detected. A neutron hitting one pixel element might also be counted in neighbouring pixels, meaning that the spatial resolution often is less than the actual detector pixel size will allow. By definition, the spatial resolution cannot be better than two times the pixel size. The basic principles will be explained in the Imaging#Detection section.
Temporal resolution
The achievable time resolution in kinetic studies depends on the available flux and the detector efficiency. The required exposure time is ruled by the signal-to-noise ratio. The relative image noise decreases when the number of counts in a detector pixel increases. Hence, the signal-to-noise ratio depends on the source flux, the size of the pinhole, the source-detector distance, the exposure time, the attenuation of the sample, the detector efficiency and additional detection noise, e.g. dark current and read out noise. Therefore the best trade off between spatial resolution and the signal-to-noise ratio has to found for each (in particular kinetic) experiment. Other sources of noise are, however, given by e.g. gamma radiation and fast neutrons reaching the detector. These background noise sources are to be avoided as much as possible through instrumentation means like shielding, filters, and avoiding a direct line of sight from the detector to the neutron source.
Neglecting the detector and background noise, it can be assumed that the counting statistics of the detector is Poisson distributed and the signal-to-noise ratio is given by \(\sigma(N)/N=1/\sqrt{N}\), where \(N\) is the number of counts in a single detector pixel.
To improve the spatial resolution both the geometric resolution, \(d\), and the effective pixel size must be reduced. Both decrease the counting number in each detector pixel, meaning that the exposure time has to be increased correspondingly to have unchanged signal-to-noise ratio. In the most efficient case the resolution of the detector system matches the geometric resolution of the set-up. The higher the signal-to-noise ratio the better objects with similar attenuation coefficients (and thickness's) can be distinguished in a radiographic image. The neutron flux at most beam lines is of the order \(10^6-10^8\) neutrons/cm\(^2\)/s and with a pixel size of the order 100 \(\mu\)m the number of counts per pixel is \(10^3-10^6\) neutrons/s.
Detection
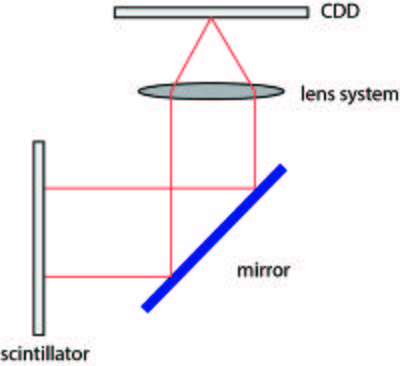
As outlined above, the main parameters characterizing an imaging detector are the detection efficiency, the electronic noise and the intrinsic spatial resolution. The most common detectors used for neutron imaging are scintillator screens in conjunction with CCD (charge-couple-device) cameras and flat amorhous-Si detectors[1][2], but meanwhile also MCP (microchannel plate) based detectors [3]. In the scintillator screen the neutrons are absorbed and visible light is emitted, which can be detected by the CCD. The most commonly used scintillator material is crystalline \(^6\)LiF/ZnS:Ag, where the neutrons are converted by the Li-atoms in order to produce light by the ZnS scintillator material[4]. The doping with silver shifts the light emission to be around 450 nm, which is in the range where the CCD is most efficient. The thickness of the scintillator screen is between 0.03 mm and 0.2 mm. The thicker the screen the more neutrons are absorbed, but the spatial resolution decreases correspondingly.
Not all neutrons will be absorbed in a scintillator screen and the CCD chip will suffer from radiation damage if placed directly behind the scintillator screen. Therefore a mirror is placed in an angle of 45\(^\circ\) behind the scintillator screen and the light is reflected to the CCD chip. A lens system is placed between the mirror and the CCD in order to record an image of the light from the scintillator on the chip, illustrated in Figure xx--CrossReference--fig:detector--xx.
Amorphous Si-detectors and MCP detectors can be placed directly in the beam and function without optics. Both the amorhous-Si and the MCP detectors require a converter, typically based on \(^{10}\)B, which has a high absorption cross section for thermal neutrons. The neutrons are captured by \(^{10}\)B to produce \(^7\)Li and \(\alpha\)-particles. For the Si-detector, the \(\alpha\)-particles pass on to the detection layer, a biased silicon layer [5]. For the MCP detector the \(\alpha\)-particles and lithium nuclei liberate free secondary electrons into the adjacent evacuated channel, illustrated in an animation [3].
Experimental considerations
In the experimental set-up factors such as electronic noise and inhomogeneities in the detector efficiency and variation in the incident beam intensity both temporally and in time, effects the image quality.
To improve image quality three images are combined to form the final image; a projection image of the sample, a dark-field and a flat-field image. The dark-field image is a image with the beam turned off used to corrected for dark-current in the detector system, meaning counts in the detector not related to the neutron beam. These counts must be subtracted from the projection images. A flat-field image is an image with open beam shutter, but without the sample placed in the beam path. The flat-field image is used to correct for inhomogeneities in the beam profile and in the detector screen. The projections (transmission image) are for each pixel corrected with both the dark-field and the flat-field images.
\begin{equation} T_{\theta}=\frac{I_{\theta}-DF}{FF-DF} \label{eq:trans}\end{equation}
with \(I_{\theta}\) being the original projection image, \(DF\) is the dark field image and \(FF\) is the flat-field image.
- ↑ 1.0 1.1 M. Strobl et al., Journal of Physics D: Applied Physics 42 (2009), p. 243001
- ↑ I. S. Anderson and R. L. McGreevy and H. Z. Bilheux, Neutron imaging and applications (Springer, 2009)
- ↑ A. S. Tremsin and W. Bruce Feller and R. Gregory Downing, Nuclear Instruments and Methods A 539 (2005), p. 278-311
- ↑ V. Litvin et al., Bulletin of the Russian Academy of Sciences: Physics 73 (2009), p. 219-221
- ↑ C. Kittel, Introduction to Solid State Physics (Wiley, 2004)
Computed tomography
Computed tomography (CT) is most commonly know for X-rays in the field of medical imaging, which is extensively used for diagnostics at hospitals. In computed tomography the interior 3D structure is reconstructed from a series of radiographic images obtained from different angles and have successfully been applied for neutrons.
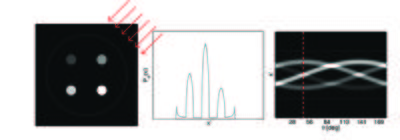
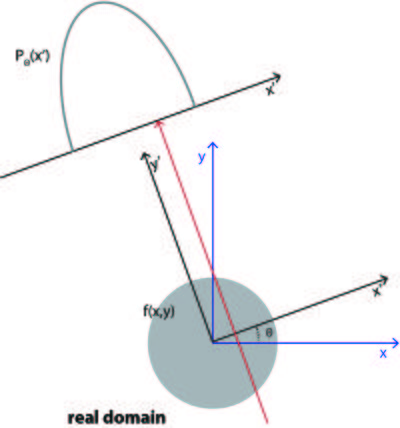
Consider the case of a 2D sample, shown in Figure xx--CrossReference--fig:tomoproj--xx(a) with the gray scale representing the interior attenuation coefficient, \(\mu(x,y)\). When illuminated by the neutron beam the projection image, \(T_{\theta}(x')\) is given by \eqref{eq:trans} and shown in Figure xx--CrossReference--fig:tomoproj--xx(b). Projections taken from several angles are collected in a sinogram, shown in Figure xx--CrossReference--fig:tomoproj--xx(c).
The aim of the tomographic reconstruction is to go from the projections back to the function \(\mu(x,y)\). The algorithm used for that is called the Filtered Backprojection Algorithm and will be derived in the following sections for a 2D sample and in the case where the beam rays are all parallel. To obtain the 3D reconstruction of the attenuation coefficient, \(\mu(x,y,z)\), the projections are measured stepwise in height and the reconstructed 2D slices are stacked to obtain the 3D structure. The derivation given below follows [1].
Tomographic reconstruction
A projection image can be mathematically expressed as an integral of the object function, \(f(x,y)\), along the beam path
\begin{eqnarray} P_{\theta}(x') &=& \int_{-\infty}^{\infty} dx \int_{-\infty}^{\infty} dy f(x,y) \delta(x\cos(\theta)+y\sin(\theta)-x') \\ &=&\int _{-\infty}^{\infty} f(x',y') dy' \label{eq:tomo_proj}\end{eqnarray}
where the variables are defined in Figure xx--CrossReference--fig:tomoproj_ill--xx and \(\delta(x)\) is the Dirac-delta function. The total projection is obtained by measuring \(P_{\theta}(x')\) for all \(x'\).
The coordinate system \((x',y')\) is the coordinate system \((x,y)\) rotated by the angle \(\theta\):
\begin{equation} \begin{pmatrix}x' \\ y'\end{pmatrix}=\begin{bmatrix} \cos\theta & \sin\theta \\ -\sin\theta & \cos\theta \end{bmatrix} \begin{pmatrix}x \\ y\end{pmatrix} \label{eq:rot_coor}\end{equation}
The projection, \(P_{\theta}(x')\), is known as the Radon transformation of the function of \(f(x,y)\)[2]. In the case of neutron (or X-ray) imaging the object function, \(f(x,y)=\mu(x,y)\), the interior attenuation coefficient. For the projection to be the Radon transformation of \(\mu(x,y)\) it is seen from \eqref{eq:flux} that \(P_{\theta}(x') =-\ln(T_{\theta}(x'))\).
The Fourier Slice Theorem
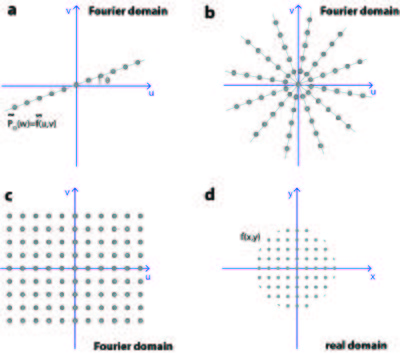
The Filtered Backprojection Algorithm is based on the Fourier Slice Theorem, which states that: The Fourier transformation of projection \(\tilde{P}_{\theta}(w)\) is equal to the Fourier transformation of the object, \(\tilde{f}(u,v)\), along a line through the origin in the Fourier domain.
The theorem is illustrated in Figure xx--CrossReference--fig:tomorecon--xx(a), where the Fourier transformation of \(P_{\theta}(x')\) is shown as a grey line in the Fourier domain. The line is rotated an angle \(\theta\) with respect to the \(u\)-axis.
The Fourier Slice Theorem can be proven directly, by taking the Fourier transform of the projection of the object, \(P_\theta(x')\) with respect to the spatial frequency \(w\):
\begin{eqnarray} \tilde{P}_{\theta}(w) &=& \int_{-\infty}^{\infty} dx' P_{\theta}(x') \exp{\left( {-i2\pi(x'w)} \right)} \nonumber \\ &=&\int_{-\infty}^{\infty} dx' \int_{-\infty}^{\infty} dy' f(x',y') \exp{\left({-i2\pi(x'w)}\right)} \nonumber \\ &=& \int_{-\infty}^{\infty} dx \int_{-\infty}^{\infty} dy f(x,y) \exp{\left({-i2\pi w(x\cos\theta+y\sin\theta)}\right)} \nonumber \\ &=& \int_{-\infty}^{\infty} dx \int_{-\infty}^{\infty} dy f(x,y) \exp{\left({-i2\pi (xu+yv)}\right)} \nonumber \\ &=& \tilde{f}(u,v) \end{eqnarray}
We here identify the spatial frequencies \(u\) and \(v\) as: \((u,v)=(w\cos\theta, w\sin\theta)\), meaning that
\begin{equation} \tilde{P}_{\theta}(w)=\tilde{f}(w\cos\theta, w\sin\theta) \end{equation}
Filtered Backprojection Algorithm

Before going into the mathematical derivation of the Filtered Backprojection Algorithm the main idea will be summarized.
Having obtained the projection from several angles, the Fourier transform of the object is known along several lines in the Fourier domain, shown in Figure xx--CrossReference--fig:tomorecon--xx(b). In order to calculate the object function by taking the inverse Fourier transformation, the Fourier transformation must be known regularly in the whole Fourier domain, as shown in Figure xx--CrossReference--fig:tomorecon--xx(c).
For this to be the case the Fourier transformation of each projection should form a pie shape in the Fourier domain, as shown in Figure xx--CrossReference--fig:fbp--xx(a). However, the Fourier Slice Theorem says that the Fourier Transformation is only known along a line, as illustrated in Figure xx--CrossReference--fig:fbp--xx(b). To approximate the ideal situation in Figure xx--CrossReference--fig:fbp--xx(a) a filter of the form \(\vert w\vert\) is applied to \(\tilde{f}(u,v)\) before taking the inverse Fourier transform, shown in Figure xx--CrossReference--fig:fbp--xx(c). From the mathematical derivation it is seen that the filter appears as the Jacobian determinant when changing from Cartesian to polar coordinates in the Fourier Domain.
The mathematical derivation of the algorithm goes backwards and starts by taking the inverse Fourier Transform of \(\tilde{f}(u,v)\).
\begin{eqnarray} f(x,y) &=& \int_{-\infty}^{\infty} du \int_{-\infty}^{\infty} dv \tilde{f}(u,v) \exp{\left({i2\pi(xu+yv)}\right)} \\ &=& \int_{0}^{2\pi} d\theta \int_{0}^{\infty} dw w\tilde{f}(w,\theta) \exp{\left({i2\pi w(x\cos\theta+y\sin\theta)}\right)} \\ &=& \int_{0}^{\pi} d\theta \int_{-\infty}^{\infty} dw \vert w\vert \tilde{f}(w,\theta) \exp{\left({i2\pi w(x\cos\theta+y\sin\theta)}\right)} \end{eqnarray}
where the coordinate transformation from \((u,v)\) to \((w,\theta)\) have introduced the Jacobian determinant, \(w\). Note that the integration limits are changed from step 2 to 3, due to the periodic properties of the Fourier Transform, which gives the filter \(\vert w\vert\).
\begin{equation} \tilde{f}(w,\theta+\pi)=\tilde{f}(-w,\theta) \end{equation}
Substituting in the projection, using the Fourier Slice Theorem gives that
\begin{align} f(x,y)=& \int_{0}^{\pi} d\theta \int_{-\infty}^{\infty} dw \vert w\vert \tilde{P}_{\theta}(w) \exp{\left({i2\pi wx'}\right)} \label{eq:fbp}\end{align}
The Fourier transform of the projection, \(\tilde{P}_{\theta}(w)\) is filtered by \(\vert w\vert\), before taking the inverse Fourier transform and backprojected by integrate over all angles in the real domain. Therefore the name Filtered Backprojection. The filter \(\vert w\vert\) is called the Ram-Lak filter, but for some applications other filters is used in order to reduce noise in the reconstructed images[1].
To use this formula, the projection must be known continuously for the angle \(\theta\) in the interval \([0,\pi]\) and in space \(x'\) in the interval \([-\infty, \infty]\). In practice the projections are measured in discrete points corresponding the pixel size of the detector and for a finite number of angle steps. Therefore the integrals in \eqref{eq:fbp} are replaced by sums, illustrated by the point in Figure xx--CrossReference--fig:tomorecon--xx.
In summary, the Filtered Backprojection Algorithm goes in the following steps:
- Collect the projections \(P_{\theta}(x')\) from a number of angle steps and number of points.
- Calculate the (discrete) Fourier Transformation, \(\tilde{P}_{\theta}(w)\) of each projection, Figure xx--CrossReference--fig:tomorecon--xx(a-b)
- Apply the filter \(\vert w \vert\) in Fourier domain, to approximate the ideal case where the measured points are equally distributed in Fourier space, Figure xx--CrossReference--fig:tomorecon--xx(c).
- Take the inverse Fourier Transformation of the filtered projection \(\vert w \vert \tilde{P}_{\theta}(w)\) and make a sum over all angles to make the reconstruction, Figure xx--CrossReference--fig:tomorecon--xx(d).
Figure xx--CrossReference--fig:tomoreconproj--xx shows the reconstruction of a 2D object, using 4 (a), 8 (b), 32 (c) and 128 projections (d) over \(180^\circ\). It is seen how the reconstruction algorithm smear the projection images back on the image plane and that the reconstruction is improved when using more projections.
To speed up the measurements a cone beam instead of a parallel beam is used in practice, illustrated in Figure xx--CrossReference--fig:setup--xx. The change in beam geometry effects the reconstruction algorithm in \eqref{eq:fbp}, since the path of the beam is changed, but the basic principle is the same. The derivation can be found in [1]. For most neutron imaging set-ups the distance between be pinhole and the detector is so large that for practical implementation the beam can be considered parallel.
Applications of neutron imaging
A particular strength of neutron imaging is the sensitivity to hydrogen, combined with the ability to penetrate bulk metal parts. Therefore water, plastic, glues, hydrogen, and organic materials can be detected in even small amount and in dense materials. This section presents examples, where neutron imaging gives novel insight.
Water transport in fuel cells
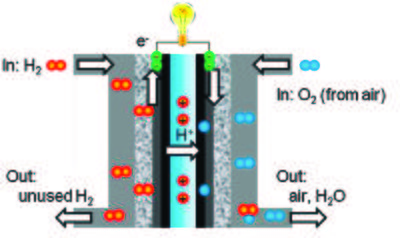
Fuel cells operate by converting a fuel into electrical power via a chemical reaction. One type of fuel cells is the hydrogen-oxygen proton exchange membrane fuel cell (PEMFCs), where hydrogen is used as the fuel and reacts with oxygen to form water. A schematic presentation of a PEMFC is shown in Figure xx--CrossReference--fig:fuelcell--xx[1]. The water must be removed through flow channels for the fuel cell to work properly and if water is not formed in an area of the fuel cell it indicates a defective area. The metallic shell of the fuel cell is almost transparent to neutrons and the interior water content can be quantified due to the high scattering cross section of hydrogen. Therefore the dynamics of the water can be quantified in a unmodified and full functional fuel cell (in situ) by neutron radiography or tomography [3].
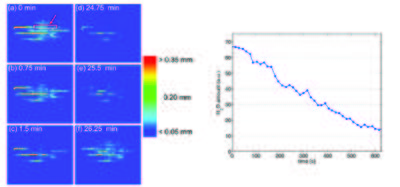
To follow the dynamics, good temporal resolution is required, as the exposure time for each projection image is limited by the time scale of the transport process. The time resolution for neutron radiography is of the order of seconds, which is well suited for these processes [4]. The difference in the attenuation coefficient of water (H\(_2\)O) and heavy water (D\(_2\)O), makes it possible not only to study the water accumulation, but also the water exchange in operational fuel cells by neutron radiography, demonstrated by [2]. Switching from hydrogen to deuterium gas, the deuterium gas is reduced to D\(_2\)O in the catalyst layer and gradually replaced water, seen in the radiographic images as a decrease in neutron attenuation. Thereby the exchange time can be measured by measuring the change in image intensity, shown in Figure xx--CrossReference--fig:fuelcell_waterflow--xx(left).
The radiographic images are normalized to the dry fuel, such that only the water content is seen and the color scale displays the local water thickness. At time \(t=0\) the fuel cell is saturated and the H\(_2\) feed gas is exchange with the D\(_2\) gas. After 24.75 min (Figure xx--CrossReference--fig:fuelcell_waterflow--xx(left)(d)) nearly all the water has been replace by heavy water, and the gas feed in again switched back to H\(_2\). The neutron beam attenuation increases, seen in Figure xx--CrossReference--fig:fuelcell_waterflow--xx(left)(e)-(f). The amount of water is calculated from the attenuation in the red marked area in Figure xx--CrossReference--fig:fuelcell_waterflow--xx(left)(a) for about the first 10 sec, shown in Figure xx--CrossReference--fig:fuelcell_waterflow--xx(right). This show that neutron radiography can be used not only to visualize but also quantify the flow process in situ.
Water uptake in plants

The difference in the attenuation coefficient of light and heavy water also makes it possible to study the water uptake in plants[5][6][7]. Figure xx--CrossReference--fig:plant--xx(left)\textbf{a} shows a neutron radiographic image of roots in soil. The surface is irrigated with 3 mL of D\(_2\)O and radiographic images are obtained 15 min, 30 min, 6 h and 12 h after irrigation, shown at Figure xx--CrossReference--fig:plant--xx(left)\textbf{b-e}. The images are normalized to the original images, meaning that in the white areas H\(_2\)O has been replaced by D\(_2\)O. The soil to the left becomes wet and the roots takes up water (WR). The soil to the right side remains dry (S) for the whole experiment, but water is transported to the roots (DR). The relative change in neutron transmission makes it possible to compare the water uptake in the different areas of the roots, Figure xx--CrossReference--fig:plant--xx(right). The water uptake by the roots placed in the moist soil is significant higher, than in the dry soil. After 6-12 h it is seen that water is transported to the stem, Figure xx--CrossReference--fig:plant--xx(left)d-e.
Cultural heritage
Imaging of cultural heritage ranges from archaeological objections to pieces of art. Here, the preserving interest is important and non-destructive testing techniques are required. Therefore, neutron tomography is a well-suited technique.
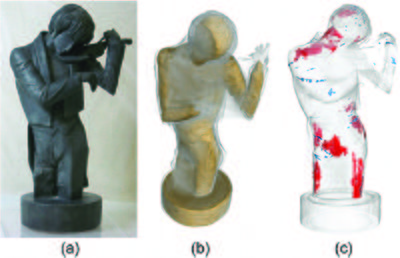
El violinista (1920) is a sculpture by the Catalan artist Pablo Gargallo. The sculpture is composed of the wooden core on which thin sheets of lead is fixed by needles and soldering. Figure xx--CrossReference--fig:violinist--xx shows a photography of the sculpture (a) and the 3D rendering of the tomographic reconstruction, showing the wooden core (b). The sculpture shows signs of corrosion, which is most likely due to organic vapours from the wood. This can be visualized by neutron tomography, due to the hydrogen sensitivity, shown as red areas in Figure xx--CrossReference--fig:violinist--xx(c).
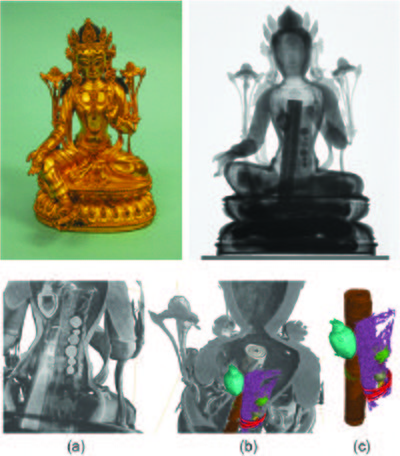
An other example is a Buddhist bronze statue. Figure xx--CrossReference--fig:bronze--xx(top row) shows a photograph (left) and neutron radiography image (right) of a 15th century Bodhisattva Avaloktesvara [8]. The objects placed inside the statue can be investigated closely by neutron tomography without effecting the statue, shown in Figure xx--CrossReference--fig:bronze--xx(bottom raw). Three objects are identified. A small heart-shaped capsuled (turquoise) wrapped in a piece of close is placed in the chest of the statue. A scroll (brown) probably containing a religious text, and a pouch (violet) containing some spherical objects and tied up with string.
- ↑ 1.0 1.1 J. Mishler et al., Electrochimica Acta 75 (2010),p. 1-10
- ↑ 2.0 2.1 2.2 I. Manke et al., Appl. Phys. Lett. 92 (2009), p. 244101
- ↑ R. Mukundan and R. Borup, Fuel Cells 9 (20??), p. 499-505
- ↑ A. Hilger and N. Kardjilov and M. Strobl and W. Treimer and J. Banhart, Physica B 385 (2006), p. 1213-1215
- ↑ 5.0 5.1 J. M. Warren et al., Plant and soil 366 (2013), p. 683-693
- ↑ S. E. Oswald et al., Vadose Zone Journal 7 (2008), p. 1035-1047
- ↑ U. Matsushima et al., Visualisation of water flow in tomato seedlings using neutron imaging, in M. Arif and R. Downing, eds, Proc. 8th World conf. on Neutron Radiography (WCNR-8, Gaithersburg, USA) (Lancaster, PA: DESTech Publ. Inc., 2006)
- ↑ 8.0 8.1 8.2 D. Mannes et al., Insight-Non-Destructive Testing and Condition Monitoring 56 (2014), p. 137-141
← Previous page: Diffraction from crystals
→ Next page: Inelastic nuclear neutron scattering
