Applications of neutron imaging: Difference between revisions
ucph>Tommy No edit summary |
m (1 revision imported) |
(No difference)
| |
Latest revision as of 22:15, 18 February 2020
A particular strength of neutron imaging is the sensitivity to hydrogen, combined with the ability to penetrate bulk metal parts. Therefore water, plastic, glues, hydrogen, and organic materials can be detected in even small amount and in dense materials. This section presents examples, where neutron imaging gives novel insight.
Water transport in fuel cells


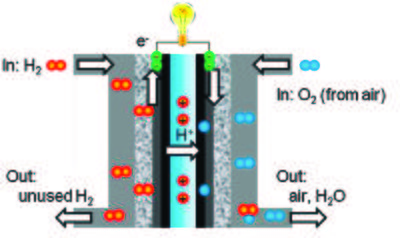
Fuel cells operate by converting a fuel into electrical power via a chemical reaction. One type of fuel cells is the hydrogen-oxygen proton exchange membrane fuel cell (PEMFCs), where hydrogen is used as the fuel and reacts with oxygen to form water. A schematic presentation of a PEMFC is shown in Figure xx--CrossReference--fig:fuelcell--xx[1]. The water must be removed through flow channels for the fuel cell to work properly and if water is not formed in an area of the fuel cell it indicates a defective area. The metallic shell of the fuel cell is almost transparent to neutrons and the interior water content can be quantified due to the high scattering cross section of hydrogen. Therefore the dynamics of the water can be quantified in a unmodified and full functional fuel cell (in situ) by neutron radiography or tomography [3].
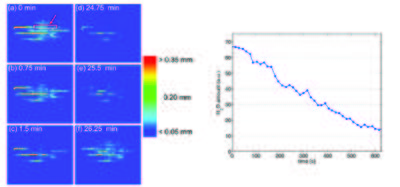
To follow the dynamics, good temporal resolution is required, as the exposure time for each projection image is limited by the time scale of the transport process. The time resolution for neutron radiography is of the order of seconds, which is well suited for these processes [4]. The difference in the attenuation coefficient of water (H\(_2\)O) and heavy water (D\(_2\)O), makes it possible not only to study the water accumulation, but also the water exchange in operational fuel cells by neutron radiography, demonstrated by [2]. Switching from hydrogen to deuterium gas, the deuterium gas is reduced to D\(_2\)O in the catalyst layer and gradually replaced water, seen in the radiographic images as a decrease in neutron attenuation. Thereby the exchange time can be measured by measuring the change in image intensity, shown in Figure xx--CrossReference--fig:fuelcell_waterflow--xx(left).
The radiographic images are normalized to the dry fuel, such that only the water content is seen and the color scale displays the local water thickness. At time \(t=0\) the fuel cell is saturated and the H\(_2\) feed gas is exchange with the D\(_2\) gas. After 24.75 min (Figure xx--CrossReference--fig:fuelcell_waterflow--xx(left)(d)) nearly all the water has been replace by heavy water, and the gas feed in again switched back to H\(_2\). The neutron beam attenuation increases, seen in Figure xx--CrossReference--fig:fuelcell_waterflow--xx(left)(e)-(f). The amount of water is calculated from the attenuation in the red marked area in Figure xx--CrossReference--fig:fuelcell_waterflow--xx(left)(a) for about the first 10 sec, shown in Figure xx--CrossReference--fig:fuelcell_waterflow--xx(right). This show that neutron radiography can be used not only to visualize but also quantify the flow process in situ.
Water uptake in plants

The difference in the attenuation coefficient of light and heavy water also makes it possible to study the water uptake in plants[5][6][7]. Figure xx--CrossReference--fig:plant--xx(left)\textbf{a} shows a neutron radiographic image of roots in soil. The surface is irrigated with 3 mL of D\(_2\)O and radiographic images are obtained 15 min, 30 min, 6 h and 12 h after irrigation, shown at Figure xx--CrossReference--fig:plant--xx(left)\textbf{b-e}. The images are normalized to the original images, meaning that in the white areas H\(_2\)O has been replaced by D\(_2\)O. The soil to the left becomes wet and the roots takes up water (WR). The soil to the right side remains dry (S) for the whole experiment, but water is transported to the roots (DR). The relative change in neutron transmission makes it possible to compare the water uptake in the different areas of the roots, Figure xx--CrossReference--fig:plant--xx(right). The water uptake by the roots placed in the moist soil is significant higher, than in the dry soil. After 6-12 h it is seen that water is transported to the stem, Figure xx--CrossReference--fig:plant--xx(left)d-e.
Cultural heritage


Imaging of cultural heritage ranges from archaeological objections to pieces of art. Here, the preserving interest is important and non-destructive testing techniques are required. Therefore, neutron tomography is a well-suited technique.
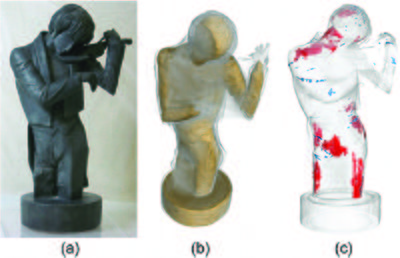
El violinista (1920) is a sculpture by the Catalan artist Pablo Gargallo. The sculpture is composed of the wooden core on which thin sheets of lead is fixed by needles and soldering. Figure xx--CrossReference--fig:violinist--xx shows a photography of the sculpture (a) and the 3D rendering of the tomographic reconstruction, showing the wooden core (b). The sculpture shows signs of corrosion, which is most likely due to organic vapours from the wood. This can be visualized by neutron tomography, due to the hydrogen sensitivity, shown as red areas in Figure xx--CrossReference--fig:violinist--xx(c).
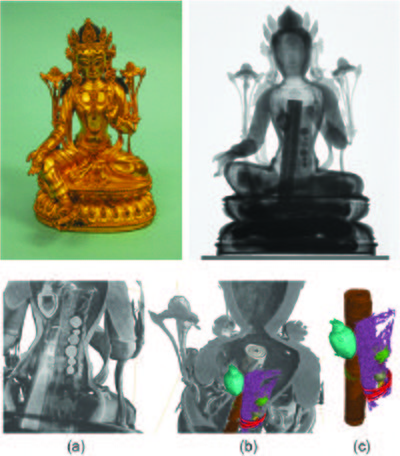
An other example is a Buddhist bronze statue. Figure xx--CrossReference--fig:bronze--xx(top row) shows a photograph (left) and neutron radiography image (right) of a 15th century Bodhisattva Avaloktesvara [8]. The objects placed inside the statue can be investigated closely by neutron tomography without effecting the statue, shown in Figure xx--CrossReference--fig:bronze--xx(bottom raw). Three objects are identified. A small heart-shaped capsuled (turquoise) wrapped in a piece of close is placed in the chest of the statue. A scroll (brown) probably containing a religious text, and a pouch (violet) containing some spherical objects and tied up with string.
- ↑ 1.0 1.1 J. Mishler et al., Electrochimica Acta 75 (2010),p. 1-10
- ↑ 2.0 2.1 2.2 I. Manke et al., Appl. Phys. Lett. 92 (2009), p. 244101
- ↑ R. Mukundan and R. Borup, Fuel Cells 9 (20??), p. 499-505
- ↑ A. Hilger and N. Kardjilov and M. Strobl and W. Treimer and J. Banhart, Physica B 385 (2006), p. 1213-1215
- ↑ 5.0 5.1 J. M. Warren et al., Plant and soil 366 (2013), p. 683-693
- ↑ S. E. Oswald et al., Vadose Zone Journal 7 (2008), p. 1035-1047
- ↑ U. Matsushima et al., Visualisation of water flow in tomato seedlings using neutron imaging, in M. Arif and R. Downing, eds, Proc. 8th World conf. on Neutron Radiography (WCNR-8, Gaithersburg, USA) (Lancaster, PA: DESTech Publ. Inc., 2006)
- ↑ 8.0 8.1 8.2 D. Mannes et al., Insight-Non-Destructive Testing and Condition Monitoring 56 (2014), p. 137-141