Computed tomography
Computed tomography (CT) is most commonly know for X-rays in the field of medical imaging, which is extensively used for diagnostics at hospitals. In computed tomography the interior 3D structure is reconstructed from a series of radiographic images obtained from different angles and have successfully been applied for neutrons.
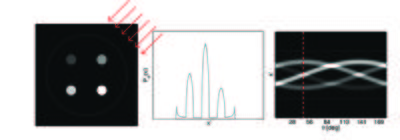
Consider the case of a 2D sample, shown in Figure xx--CrossReference--fig:tomoproj--xx(a) with the gray scale representing the interior attenuation coefficient, \(\mu(x,y)\). When illuminated by the neutron beam the projection image, \(T_{\theta}(x')\) is given by \eqref{eq:trans} and shown in Figure xx--CrossReference--fig:tomoproj--xx(b). Projections taken from several angles are collected in a sinogram, shown in Figure xx--CrossReference--fig:tomoproj--xx(c).
The aim of the tomographic reconstruction is to go from the projections back to the function \(\mu(x,y)\). The algorithm used for that is called the Filtered Backprojection Algorithm and will be derived in the following sections for a 2D sample and in the case where the beam rays are all parallel. To obtain the 3D reconstruction of the attenuation coefficient, \(\mu(x,y,z)\), the projections are measured stepwise in height and the reconstructed 2D slices are stacked to obtain the 3D structure. The derivation given below follows [1].
Tomographic reconstruction
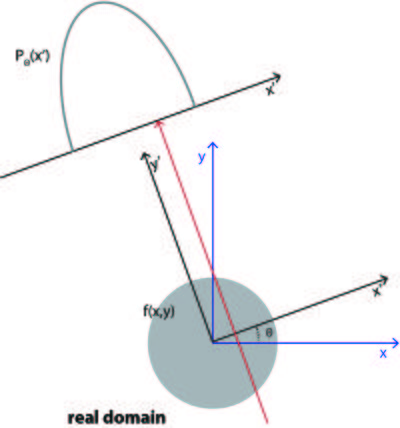
A projection image can be mathematically expressed as an integral of the object function, \(f(x,y)\), along the beam path
\begin{eqnarray} P_{\theta}(x') &=& \int_{-\infty}^{\infty} dx \int_{-\infty}^{\infty} dy f(x,y) \delta(x\cos(\theta)+y\sin(\theta)-x') \\ &=&\int _{-\infty}^{\infty} f(x',y') dy' \label{eq:tomo_proj}\end{eqnarray}
where the variables are defined in Figure xx--CrossReference--fig:tomoproj_ill--xx and \(\delta(x)\) is the Dirac-delta function. The total projection is obtained by measuring \(P_{\theta}(x')\) for all \(x'\).
The coordinate system \((x',y')\) is the coordinate system \((x,y)\) rotated by the angle \(\theta\):
\begin{equation} \begin{pmatrix}x' \\ y'\end{pmatrix}=\begin{bmatrix} \cos\theta & \sin\theta \\ -\sin\theta & \cos\theta \end{bmatrix} \begin{pmatrix}x \\ y\end{pmatrix} \label{eq:rot_coor}\end{equation}
The projection, \(P_{\theta}(x')\), is known as the Radon transformation of the function of \(f(x,y)\)[2]. In the case of neutron (or X-ray) imaging the object function, \(f(x,y)=\mu(x,y)\), the interior attenuation coefficient. For the projection to be the Radon transformation of \(\mu(x,y)\) it is seen from \eqref{eq:flux} that \(P_{\theta}(x') =-\ln(T_{\theta}(x'))\).
The Fourier Slice Theorem

The Filtered Backprojection Algorithm is based on the Fourier Slice Theorem, which states that: The Fourier transformation of projection \(\tilde{P}_{\theta}(w)\) is equal to the Fourier transformation of the object, \(\tilde{f}(u,v)\), along a line through the origin in the Fourier domain.
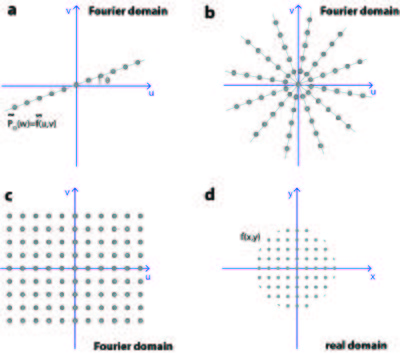
The theorem is illustrated in Figure xx--CrossReference--fig:tomorecon--xx(a), where the Fourier transformation of \(P_{\theta}(x')\) is shown as a grey line in the Fourier domain. The line is rotated an angle \(\theta\) with respect to the \(u\)-axis.
The Fourier Slice Theorem can be proven directly, by taking the Fourier transform of the projection of the object, \(P_\theta(x')\) with respect to the spatial frequency \(w\):
\begin{eqnarray} \tilde{P}_{\theta}(w) &=& \int_{-\infty}^{\infty} dx' P_{\theta}(x') \exp{\left( {-i2\pi(x'w)} \right)} \nonumber \\ &=&\int_{-\infty}^{\infty} dx' \int_{-\infty}^{\infty} dy' f(x',y') \exp{\left({-i2\pi(x'w)}\right)} \nonumber \\ &=& \int_{-\infty}^{\infty} dx \int_{-\infty}^{\infty} dy f(x,y) \exp{\left({-i2\pi w(x\cos\theta+y\sin\theta)}\right)} \nonumber \\ &=& \int_{-\infty}^{\infty} dx \int_{-\infty}^{\infty} dy f(x,y) \exp{\left({-i2\pi (xu+yv)}\right)} \nonumber \\ &=& \tilde{f}(u,v) \end{eqnarray}
We here identify the spatial frequencies \(u\) and \(v\) as: \((u,v)=(w\cos\theta, w\sin\theta)\), meaning that
\begin{equation} \tilde{P}_{\theta}(w)=\tilde{f}(w\cos\theta, w\sin\theta) \end{equation}
Filtered Backprojection Algorithm

Before going into the mathematical derivation of the Filtered Backprojection Algorithm the main idea will be summarized.
Having obtained the projection from several angles, the Fourier transform of the object is known along several lines in the Fourier domain, shown in Figure xx--CrossReference--fig:tomorecon--xx(b). In order to calculate the object function by taking the inverse Fourier transformation, the Fourier transformation must be known regularly in the whole Fourier domain, as shown in Figure xx--CrossReference--fig:tomorecon--xx(c).
For this to be the case the Fourier transformation of each projection should form a pie shape in the Fourier domain, as shown in Figure xx--CrossReference--fig:fbp--xx(a). However, the Fourier Slice Theorem says that the Fourier Transformation is only known along a line, as illustrated in Figure xx--CrossReference--fig:fbp--xx(b). To approximate the ideal situation in Figure xx--CrossReference--fig:fbp--xx(a) a filter of the form \(\vert w\vert\) is applied to \(\tilde{f}(u,v)\) before taking the inverse Fourier transform, shown in Figure xx--CrossReference--fig:fbp--xx(c). From the mathematical derivation it is seen that the filter appears as the Jacobian determinant when changing from Cartesian to polar coordinates in the Fourier Domain.
The mathematical derivation of the algorithm goes backwards and starts by taking the inverse Fourier Transform of \(\tilde{f}(u,v)\).
\begin{eqnarray} f(x,y) &=& \int_{-\infty}^{\infty} du \int_{-\infty}^{\infty} dv \tilde{f}(u,v) \exp{\left({i2\pi(xu+yv)}\right)} \\ &=& \int_{0}^{2\pi} d\theta \int_{0}^{\infty} dw w\tilde{f}(w,\theta) \exp{\left({i2\pi w(x\cos\theta+y\sin\theta)}\right)} \\ &=& \int_{0}^{\pi} d\theta \int_{-\infty}^{\infty} dw \vert w\vert \tilde{f}(w,\theta) \exp{\left({i2\pi w(x\cos\theta+y\sin\theta)}\right)} \end{eqnarray}
where the coordinate transformation from \((u,v)\) to \((w,\theta)\) have introduced the Jacobian determinant, \(w\). Note that the integration limits are changed from step 2 to 3, due to the periodic properties of the Fourier Transform, which gives the filter \(\vert w\vert\).
\begin{equation} \tilde{f}(w,\theta+\pi)=\tilde{f}(-w,\theta) \end{equation}
Substituting in the projection, using the Fourier Slice Theorem gives that
\begin{align} f(x,y)=& \int_{0}^{\pi} d\theta \int_{-\infty}^{\infty} dw \vert w\vert \tilde{P}_{\theta}(w) \exp{\left({i2\pi wx'}\right)} \label{eq:fbp}\end{align}
The Fourier transform of the projection, \(\tilde{P}_{\theta}(w)\) is filtered by \(\vert w\vert\), before taking the inverse Fourier transform and backprojected by integrate over all angles in the real domain. Therefore the name Filtered Backprojection. The filter \(\vert w\vert\) is called the Ram-Lak filter, but for some applications other filters is used in order to reduce noise in the reconstructed images[1].
To use this formula, the projection must be known continuously for the angle \(\theta\) in the interval \([0,\pi]\) and in space \(x'\) in the interval \([-\infty, \infty]\). In practice the projections are measured in discrete points corresponding the pixel size of the detector and for a finite number of angle steps. Therefore the integrals in \eqref{eq:fbp} are replaced by sums, illustrated by the point in Figure xx--CrossReference--fig:tomorecon--xx.
In summary, the Filtered Backprojection Algorithm goes in the following steps:
- Collect the projections \(P_{\theta}(x')\) from a number of angle steps and number of points.
- Calculate the (discrete) Fourier Transformation, \(\tilde{P}_{\theta}(w)\) of each projection, Figure xx--CrossReference--fig:tomorecon--xx(a-b)
- Apply the filter \(\vert w \vert\) in Fourier domain, to approximate the ideal case where the measured points are equally distributed in Fourier space, Figure xx--CrossReference--fig:tomorecon--xx(c).
- Take the inverse Fourier Transformation of the filtered projection \(\vert w \vert \tilde{P}_{\theta}(w)\) and make a sum over all angles to make the reconstruction, Figure xx--CrossReference--fig:tomorecon--xx(d).
Figure xx--CrossReference--fig:tomoreconproj--xx shows the reconstruction of a 2D object, using 4 (a), 8 (b), 32 (c) and 128 projections (d) over \(180^\circ\). It is seen how the reconstruction algorithm smear the projection images back on the image plane and that the reconstruction is improved when using more projections.
To speed up the measurements a cone beam instead of a parallel beam is used in practice, illustrated in Figure xx--CrossReference--fig:setup--xx. The change in beam geometry effects the reconstruction algorithm in \eqref{eq:fbp}, since the path of the beam is changed, but the basic principle is the same. The derivation can be found in [1]. For most neutron imaging set-ups the distance between be pinhole and the detector is so large that for practical implementation the beam can be considered parallel.


